The best indicators for day trading

To trade and invest wisely, you need to have a clear understanding of the coin and stock. You can easily understand the coin's underlying value using indicators for day trading. It doesn't mean that you should always know the protocol or company standing behind a specific coin. However, you need to have a minimum knowledge and understanding of the best indicators for intraday trading, which you can use to multiply your profits. Those new to the cryptocurrency world looking for an ultimate list of the best indicators for day trading with clear explanations should consider bookmarking this article for future reference. This guide explains “What indicators are best for day trading?” and gives insights into the most important indicators for day trading. At the end of this blog post, you will get an idea of the best indicator for intraday trading in cryptocurrency that you can rely on for better decision-making.
What is day trading?
Before we find out what is the best indicator for day trading, let's begin with a definition.
Day trading refers to the practice of buying and selling stocks within a single trading day to earn short-term profits. One of the primary goals of day trading is to earn a tiny profit on each trade and multiply those earnings over time.
Day traders use different intraday strategies:
- The scalping strategy lets traders make numerous small profits on small price changes within a single trading day.
- Using the range trading strategy, traders make up the buy and sell decisions based on the support and resistance levels.
- The trading strategy considers increased volatility caused by news events to seize trading opportunities.
- As part of the high-frequency trading strategy, traders use sophisticated algorithms to exploit small or short-term market inefficiencies.
What is technical analysis?
Before recommending good indicators for day trading, let's start with the fundamentals and explain technical analysis.
To explain the process of technical analysis in simple words, let's draw a comparison with a customer's behaviour while visiting a food court for the first time. There is likely to be a wide choice of options from the world-known franchises. The best approach to decide on what to choose would be to observe what vendor has the maximum number of buyers and deduce that it's the eatery offering the best food. In that way, you rely on the crowd's decision and suggest that the preferences of the majority of buyers would match yours.
The idea standing behind technical analysis is very similar to this example. Market data and trends influence your decision and your stock or cryptocurrency trading based on the patterns you derive from the market data.
What are indicators for day trading?
Here comes the most important part of this post. What are the best technical indicators for day trading?
There may be different interpretations of the price charts of different stocks and coins. Support levels can be unstable during the technical analysis as traders have various prejudices that can draw support lines at different price points. Technical indicators for day trading are used to reduce uncertainty. Technical indicators are mathematical calculations used to specify the plot lines and identify the main tendencies for coins and stocks.
Now that we understand what technical analysis is, let's delve into the best indicators for day trading.
Intraday Indicators
There are two major types of intraday indicators:
- Leading indicators are among the most used indicators for day tradingthat point to the stock or coin price while predicting the likelihood of a reversal or a new trend before it occurs.
- Lagging indicators for day trading suggest the price and the possibility of a new trend or reversal after it occurs.
Before moving further, we should note that none of the indicators for day trading are completely accurate, and you should be careful when using them for trading.
SuperTrend
The SuperTrend is one of the leading indicators for day trading, similar to moving averages. Its placement can determine it vis-a-vis the price. It's one of the simplest indicators for day trading based on two parameters: the period and the multiplier.
How to use technical indicators for day trading? While constructing the SuperTrend indicator, the Average True Range (ATR) features the default parameter of 10, and the multiplier is set at 3. The SuperTrend uses the Average True Range indicator to compute its value and signal the degree of price volatility.
To check the SuperTrend for intraday trading, use the chart of the stock you'd like to track and set the time interval to 10 minutes. Feel free to use any good charting software and use your custom settings to check the indicator.
Using SuperTrend, you shouldn't avoid using a Stop Loss. Put it at the green indicator line for a long position or at the red line indicator for a short position. Using the SuperTrend indicator along with the Stop Loss patterns is the best solution for multiplying your earnings in trading.
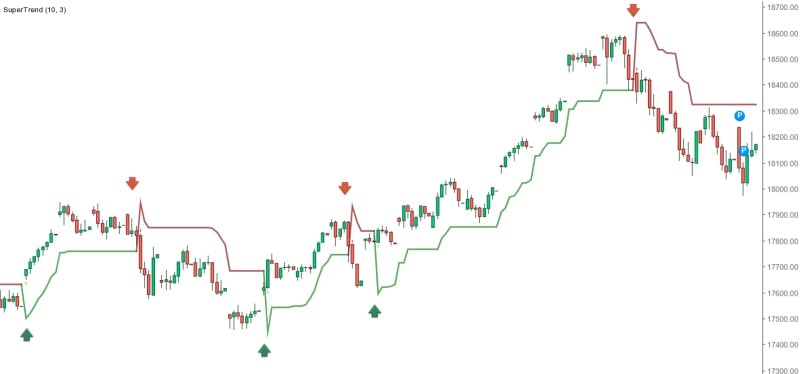
In the example above, you can see that the SuperTrend indicator reveals an upward trend when it's placed below the bars. When placed above the bars, the trend is downward. When the colour changes to green, it indicates a buy signal. You have a sell signal when the SuperTrend turns red and closes above the price. This would be the most comprehensive definition of day trading indicators for beginners.
On-Balance Volume
On-Balance Volume comes next on the list of the most important indicators for day trading. It indicates how volume changes over time. It also reveals the number of stocks bought and sold over time. Whenever the stock price changes, the indicator shows how strong the move is. On-Balance Volume is one of the major volume indicators for day trading.
The On-Balance Volume (OBV) indicator studies the asset's accumulated trading volume over a set time. The indicator takes into consideration the trading volume of the previous days, weeks and months. Put simply, it measures the coin's/stock's buying and selling pressure.
The three major rules to calculate OBV include:
- If today's price of the stock/coin is higher than yesterday's closing price:
| Current OBV = Yesterday's OBV + Today's trading volume |
- If today's price of the stock/coin is lower than yesterday's closing price:
| Current OBV = Yesterday's OBV - Today's trading volume |
- If today's price of the stock/coin is equal to yesterday's indicators:
| Yesterday's OBV = Today's OBV |
The OBV interpretation commonly sounds like this:
- An increasing OBV is a positive indicator of the price rallying. It means that more buyers are willing to purchase the asset at the trading price.
- A decreasing OBV indicates high selling pressure. As a rule, it's found near the all-time highs as traders sell to book profits.
The trend direction is confirmed when volume supports the price movement. If the price movement is opposite to the OBV movement, the indicator reflects confusion in the market.
OBV is one of the best trend indicators for day trading. However, it's not recommended to fully rely on it to make day trading decisions.
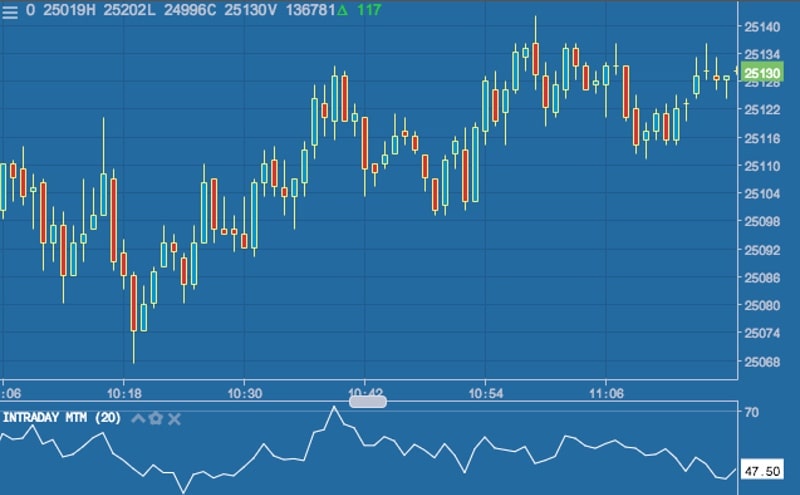
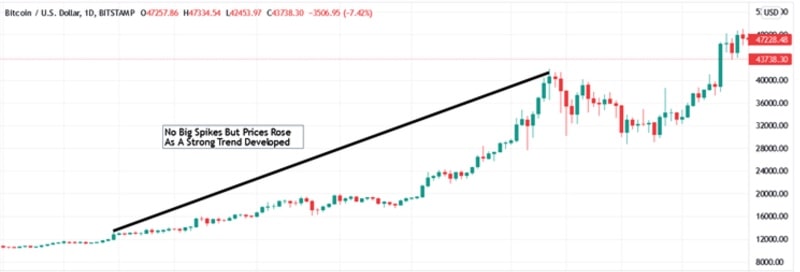
In the example provided below, you can see a sustainable increase in OBV, which indicates potential price breakouts.
Momentum
The Relative Strength Index is one of the Momentum indicators used for specifying the top and bottom prices. Momentum indicates the trend's strength and reveals the reversal likelihood. There is one more Momentum indicator called the Intraday Momentum Index. It's the most accurate indicator for day trading, similar to the Relative Strength Index. If the former is used to measure the change between the open and close prices of the current bars, the latter uses the prior bar's close to the current bar's close change. The current price is presented as a percentage between 0 and 100.
Volatility
Volatility is one of the top indicators for day trading. It's an indicator of the price change over a chosen time. Higher volatility illustrates high price moves, i.e., high risks that the trader should estimate to happen in the future.
If the stock price reaches new highs and lows within a short period, it indicates high stock volatility. If the stock price moves higher and lower more slowly or remains more or less stable, it indicates low stock volatility.
Best indicators for day trading crypto
Listed below are 3 good indicators for day trading that investors should consider for better results.
Accumulation/Distribution Line
The Accumulation/Distribution Line (A/D Line) is one of the most reliable indicators for day trading used to set the trend direction of a stock or coin based on the price and trading volume relationship. The A/D line indicator measures if a stock or coin is accumulated or distributed, where accumulation implies the buying levels of an asset and distribution represents its selling levels.
There are two metrics needed to calculate the A/D line. These are the Money Flow Multiplier (MFM) and Money Flow Volume (MFV).
To calculate the metric's value, the following formulae are used:
| MFM = [(C - L) - (H - C)] / (H - L) |
| MFV = Volume for the specific period * MFM |
Where C stands for Closing Price, L for Lowest Price, and H for the Highest Price for that specific period.
To draw the A/D line, add the Previous A/D Line value to the Current Period's MFC. Since the A/D line runs total, the current A/D value is added to the MFC of the next day, thus continuing the A/D line.
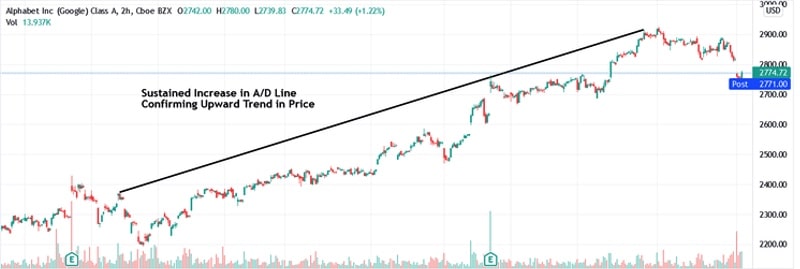
The A/D line is one of the best indicators for day trading. Use it to confirm the existing trend and keep an eye on the buying/selling pressure. However, it's not recommended to focus your day trading decisions only on the A/D line as a standalone indicator. Traders can achieve much better results when using it in combination with other technical aspects.
Let's consider the following example of the 6-month chart of Alphabet Inc. It reveals an increase in the A/D line and a leap in the stock's price.
Average Directional Index
The Average Directional Index (ADX) indicator is one of the best indicators for crypto day trading. It uses the direction/trend of the coin/stock as the key technical measurement. When the trend moves upward, the +DI positive directional indicator is recorded. When the trend goes downward, you'll see the -DI negative directional indicator.
ADX measures the strength of the current trend of the coin or stock. Investors and traders can use the indicator to place their bets on whether to short or long the asset.
To calculate the ADX, you need to divide the period into 14 bars. However, the indicator can also be used for shorter timelines of 7 bars or longer ones of 14 bars. Shorter bars make the ADX too volatile, while longer bars are more time-intensive, though they're less reliable for day trading.
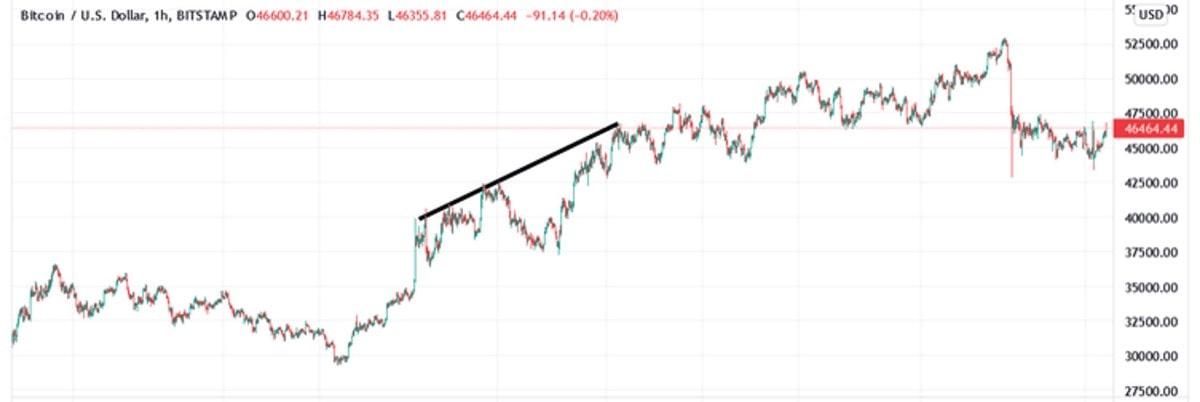
Let's consider the following example. The ADX of Bitcoin remained at the level of 30 for the major part of the timeframe. However, it also leapt to 60 at times, but it didn't affect the price level.
Aroon Indicator
The Aroon Indicator is one of the top indicators for day trading. Similar to ADX, the Aroon indicator lets traders indicate trends and measure their strengths. Two Aroon lines make up the Aroon Indicator. These are the AroonUp line and AroonDown line, both of which are measured on a scale from 0 to 100.
The AroonUp Line assesses the asset's uptrend by reflecting the number of days since its price reached the 25-day high. It means that if the asset currently stays at its 25-day high, its AroonUp value is 100. The lower the AroonUp indicator is, the weaker the asset's trend is.
To calculate the AroonUp line's value, use the following formula:
| [(number of periods) – (number of periods since highest high)] / (number of periods)] x 100 |
The AroonDown line reflects the number of days since the asset's price reached its 25-day low. Like the AroonUp line, the sentiment is stronger when the AroonDown's value gets closer to 100.
Use the following formula to calculate the AroonDown line:
| [(number of periods) – (number of periods since lowest low)] / (number of periods)] x 100 |
With that said, let's see how to interpret the Aroon Indicator:
- If the AroonUp line's value ranges between 70 and 100, and the AroonDown line's value is between 0 and 30, it means the asset is expected to grow higher.
- If the AroonUp line's value ranges between 0 and 30, and the AroonDown line's value grows, it means the asset will continue hitting low prices consistently.
- If the values of the AroonUp and AroonDown lines are equal, the asset consolidates at a specific price point.
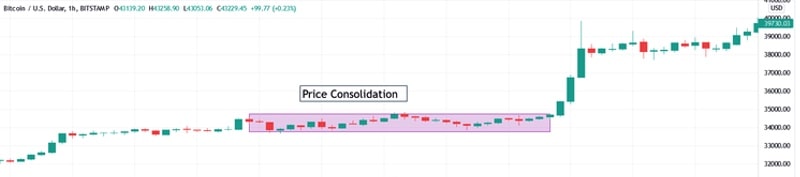
In the following example, you can see the AroonUp and AroonDown lines moving in parallel to each other, thus indicating the Bitcoin consolidation at the chosen timeframe.
The Top 3 indicators for day trading crypto
Moving Averages
Moving Averages is one of the most frequently used indicators for day trading. It provides information about the asset's momentum in the market, its trends, the Stop Loss and the Take-Profit points. Using the Moving Averages indicator, traders can check out the trading opportunities of the chosen asset in the direction of the current market trend.
While looking at a price chart, you can see the price of the selected asset fluctuates wildly. The Moving Averages smooth out the price while taking the price average over a rolling number of periods. As a result, you get a smooth line that indicates the trend's direction.
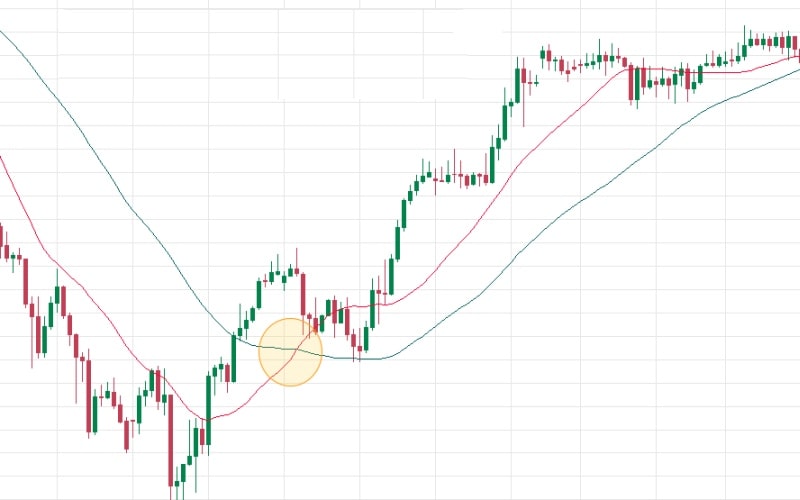
Here's how the Moving Averages, one of the best trend indicators for day trading, is used. The trend goes up when the line slopes up, and the trend goes down when the line slopes down. The indicator also signals when the asset's price crosses the moving average or when a shorter moving average crosses a longer-term moving average.
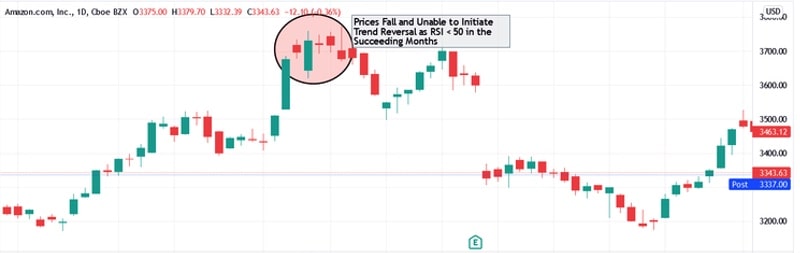
Relative Strength Index
The Relative Strength Index (RSI) is an oscillator, one of the best momentum indicators for day trading, that measures an asset's speed and the change in its movement. The RSI value ranges from 0 to 100, indicating that the stock or coin is overbought or oversold.
The RSI indicators are interpreted in the following way:
- If the RSI is above 70, the market is overbought.
- If the RSI is below 30, the market is oversold.
- If RSI is above 50, the market is in an uptrend.
- If the RSI is below 50, the market is in a downtrend.
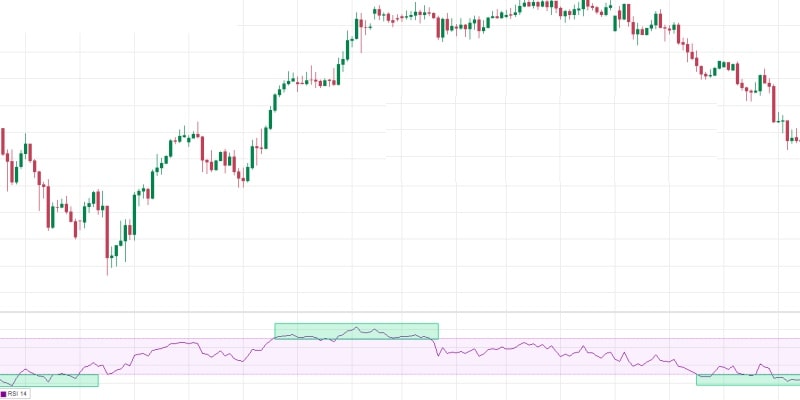
As a rule, traders use the RSI indicator to find overbought and oversold market conditions, i.e., the asset's price may move too quickly or reverse. Traders compare the RSI swings with the asset's price swings to find divergence between the two. The latter is another signal that the move of the current price of the asset might reverse.
In terms of short-term trading, the price can rapidly change its direction. Momentum indicators for day trading, like the RSI, are the leading indicators, meaning that the RSI price direction may change before the price. It provides traders with a signal that it's time to leave the trade before the asset's price reverses.
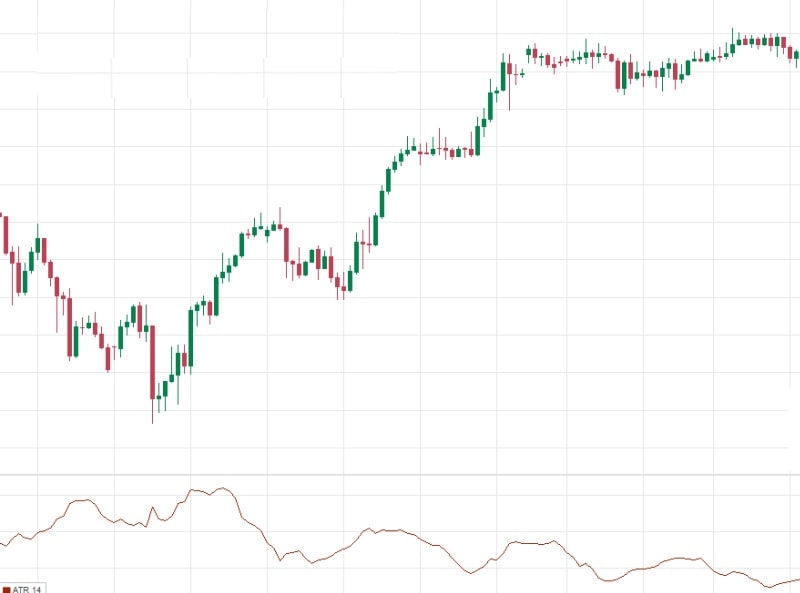
Average True Range
Average True Range (ATR) indicators can be presented as a single number or an underlay that shows how the asset has changed over time. It indicates the average number of points the market has moved over a certain time. As a rule, the measure is set at 14 periods.
The ATR is used to measure realised volatility, i.e., the indicator of how much the market has moved over a selected period. The information is useful for day traders looking forward to deciding where to place Stop Loss or Take-Profit orders.
Additional day trading indicators
Bollinger Bands
Bollinger Bands are used to indicate market volatility. There are three types of Bollinger Bands:
- A middle bang, i.e., a 20-day simple moving average
- A +2 standard deviation upper bang
- A -2 lower deviation lower band
The asset price moves between the lower and upper bands. The band widens when the market moves and volatility values increase. The gap decreases when the volatility grows lower.
Commodity Channel Index
The indicator is used to find new market trends. Its values range from -100 to 0 and from 0 to +100. If the value is positive, the Commodity Channel Index indicates an uptrend. A negative Commodity Channel Index value indicates a downtrend. Traders commonly use the indicator with RSI to get the right information about overbought or oversold stocks.
Stochastic Oscillator
The Stochastic Oscillator indicator is one of the best indicators for day trading crypto. The indicator compares the stock's closing price to a range of prices over a chosen time. The Stochastic Oscillator was developed to follow the speed of the price.
To measure an asset's momentum, the indicator oscillates between 0 and 100. Depending on the goal of the analysis, you can choose the 14-period, which can be 14 days, weeks or months.
To calculate the Stochastic Oscillator, the following formula is used:
| %K = (Current Close - Lowest Low)/(Highest High - Lowest Low) * 100 |
| %D = 3-day SMA of %K — This acts as a Signal/Trigger Line |
Where the Lowest Low stands for the lowest low for the timeframe, and the Highest High is the highest high for the timeframe.
- If the Stochastic Oscillator readings are below 20, the stock's/coin's current price is nearing its low in the chosen timeframe.
- If the Stochastic Oscillator readings are above 80, the stock's/coin's current price is nearing the highest price in the chosen timeframe.
Though the Stochastic Oscillator is considered one of the best technical indicators for day trading, it's not advisable to use it as the sole indicator for building a holistic trading strategy.
Conclusion
The purpose of this article was to familiarise you with the top indicators for day trading and their most effective combinations. It's vital to understand trading indicators, their interpretations and their limitations before employing any of them. Using this knowledge in combination with the risk appetite, you can become a successful trader.
Tags
Try our Bitcoin Cloud Miner and get additional crypto rewards based on your trading volume. It's immediately available upon registration.
Try our Bitcoin Cloud Miner and get additional crypto rewards based on your trading volume. It's immediately available upon registration.
FAQ
What are the best indicators for day trading?
The best indicators for day trading include a combination of leading and lagging indicators. Leading indicators, such as the SuperTrend and On-Balance Volume, help predict price reversals or new trends before they occur. Lagging indicators, such as Moving Averages and Relative Strength Index (RSI), provide insights into past price movements and trends.
What are the most important indicators for day trading?
The most important indicators for day trading vary depending on individual trading strategies and preferences. However, commonly used indicators include SuperTrend, On-Balance Volume, Moving Averages, Relative Strength Index (RSI), and Average True Range (ATR). These indicators help traders make informed decisions based on price trends, volume, volatility, and momentum.
What are the most used indicators for day trading?
Some of the most widely used indicators for day trading are SuperTrend, On-Balance Volume, Relative Strength Index (RSI), Moving Averages, and Average True Range (ATR). These indicators are popular among day traders for their ability to provide valuable insights into market trends, price movements, and trading opportunities.