How to do technical analysis for cryptocurrency

As the popularity of Bitcoin and other cryptocurrencies grows, so does the number of traders in the crypto market. Cryptocurrencies' high volatility allows traders to make good money on price fluctuations, but relying solely on luck or intuition in trading is a bad idea. A trader needs to analyse the market constantly. Fortunately, there are several methods of market analysis available today. One of these methods is cryptocurrency technical analysis.
Charts really are the 'footprint of money'.- Fred McAllen, Charting and technical analyst.
How to learn crypto technical analysis
Technical analysis of cryptocurrency is a method to determine how and when to trade an asset and to predict its possible price movements through the study of past market data. Unlike fundamental analysis, technical analysis in crypto trading does not try to determine an asset's 'true price'. Instead, it relies on the history of the asset's price movements.
Dow Theory
Technical analysis for crypto trading is based on the Dow Theory, named after its originator, Charles Dow. This theory consists of six fundamental ideas.
- The market discounts everything. According to this idea, the price of an asset already incorporates all information about this asset, including market sentiment and traders' expectations.
- There are three kinds of market trends. Price movement is not chaotic; it moves in trends. There are primary or main trends that last from several months to more than a year. Within primary trends, there are secondary trends, which are often corrections to primary trends and usually last several weeks. Finally, there are short or minor trends that last less than one or two weeks.
- There are three phases of primary trends. Any primary trend has three consecutive phases:
- Accumulation. At this stage, experienced traders begin to buy or sell an asset. Because there are so few of them, the price does not change much.
- Public participation. As more traders begin to notice a new trend and follow it, the price starts to change rapidly.
- Distribution. Experienced traders start to distribute their holdings during rampant speculation.
- Indices must confirm each other. Signals on one index must confirm the signals of another. In terms of the cryptocurrency market, this principle can be seen in the correlation between cryptocurrency pairs' movements.
- Volume must confirm the trend. If the price movement is accompanied by an increase in volume, it means the price moves in the trend's direction. If the volume decreases, the price is moving against the trend.
- A trend keeps going until it gives clear signals of its reversal. The price is more likely to keep up with the current trend than it is to change the trend. A reversal in primary trends can be tricky to identify. Reversals are often confused with secondary trends.
How to read cryptocurrency technical analysis charts
There are many methods used in crypto technical analysis today, but they usually belong to a specific type:
- Trade statistics: volumes, etc.
- Candlestick analysis
- Chart patterns
- Resistance and support levels
- Technical indicators
Experienced traders usually combine several different techniques in their methods and wait for their mutual confirmation. A confirmed signal can be considered more reliable for decision-making.
It's important to understand that you can't know for sure how the price will move in the future. But you can determine which situations are probably good for opening a position and which aren't. That's why it's always important to keep risk management in mind.
Timeframes
There's no perfect timeframe for any coin at any given time. Longer timeframes are generally more important, but this doesn't mean that you won't find good trades on shorter timeframes. So, the question is, "how to do technical analysis on cryptocurrency?" Check multiple timeframes and evaluate trading opportunities accordingly.
The choice of a timeframe depends on a trader's trading strategy. So-called scalpers, who open and close their positions quickly, prefer very short timeframes, such as 1-minute or 5-minute charts. Intraday traders, who usually enter and exit trades within a single day, primarily use 5-minute, 15-minute or hourly charts. Finally, position traders who prefer a long-term approach to trading use daily or even weekly charts.
When the market experiences heavy fluctuations, a shorter timeframe is often more appropriate for identifying better entry and exit points than a longer timeframe.
Volume
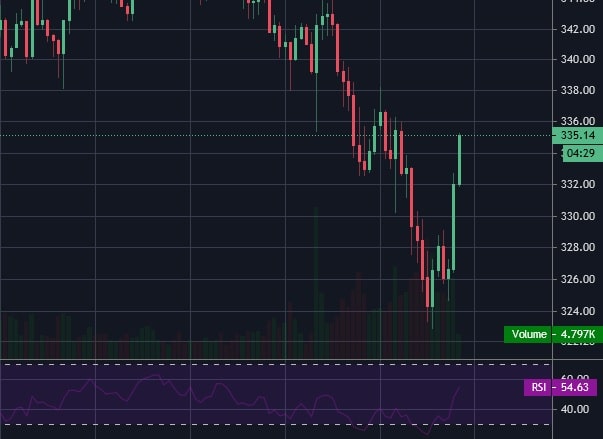
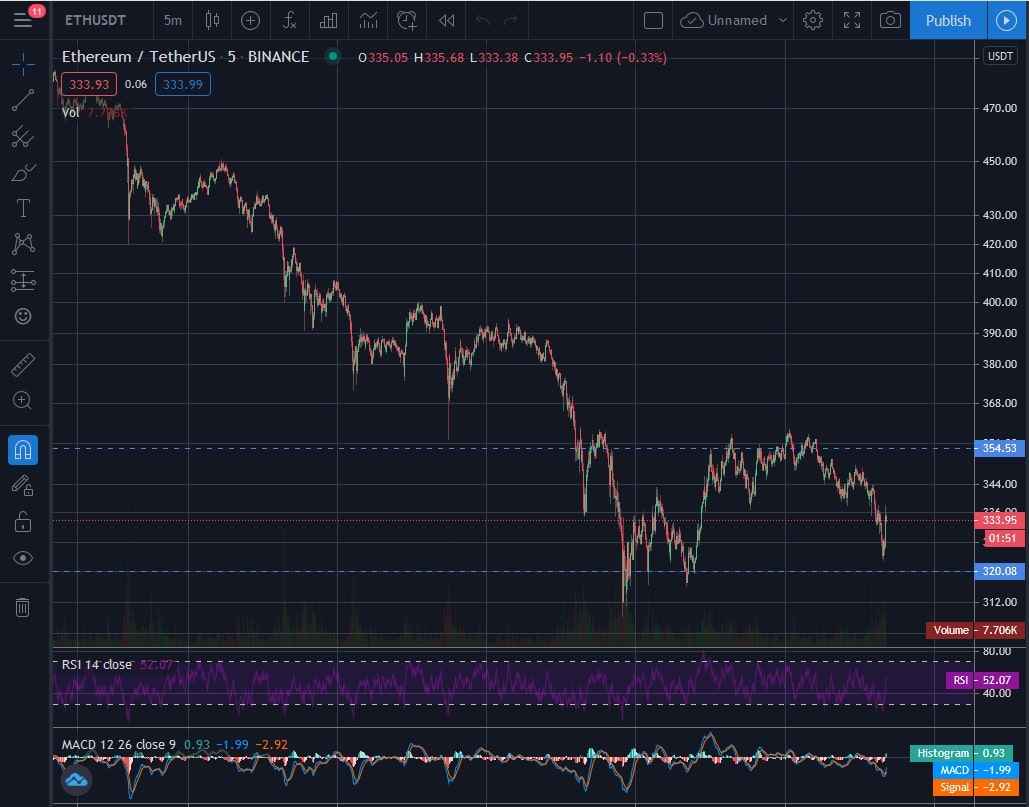
Trading volume plays a major role in the technical analysis of cryptocurrency and other assets. Volume is the number of coins traded in a chosen timeframe. It's often shown as a row of columns along the bottom of a price chart. The height of these columns serves as a visual identifier of the volume. Volume indicates just how serious a trend is. Stronger trends are accompanied by higher trading volume and vice versa.
Candlestick
Japanese candlesticks are the most popular chart type for reading and analysing price charts. Want to know how to do technical analysis of cryptocurrency using candlesticks?
Each of these candles shows a coin's price movement during a selected timeframe. Every candle consists of a body and up to two shadows and can be green or red. The body represents the difference between the opening and closing prices. If the body is green, the bottom of it shows the opening price, and the top of it shows the closing price. For red candles, the opposite is true. Thus, the green candlestick shows that the closing price in this period was higher than the opening price, i.e., the price increased. Green candles are called "bullish". In turn, a red candle indicates a decline in price and is called "bearish".
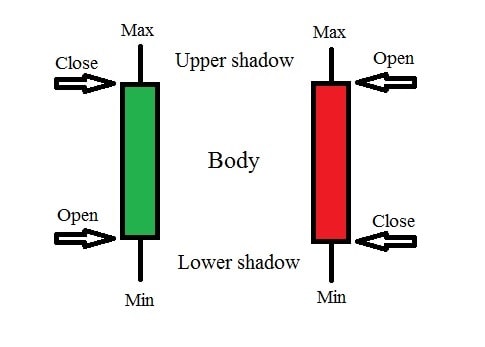
The shadows that come out of the body show the range of prices from lowest to highest within that period.
This type of price chart is very useful because it shows us the most important information about price movements at a given time. This is one of the best ways to do technical analysis of crypto for beginners. We clearly understand if the price rose or fell in the selected timeframe, and we see the maximum and minimum price values for that period.
Sometimes, groups of candlesticks fall into recognisable patterns with their own names. Let's look at some of them.
Bullish reversal patterns
Bullish reversal patterns are formed after a decline in price and indicate a possible change in the trend.
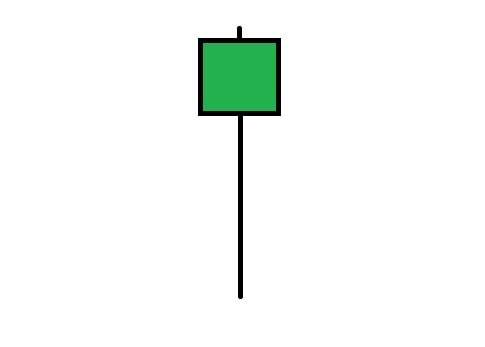
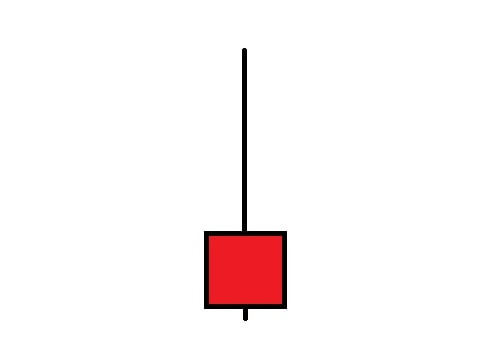
- The bullish hammer is a one-candle pattern. The body of the candle is short, with a small to no upper shadow and a long lower shadow. This is a sign that sellers are driving the price lower during the period, followed by strong pressure from buyers that ended the period with a higher close.
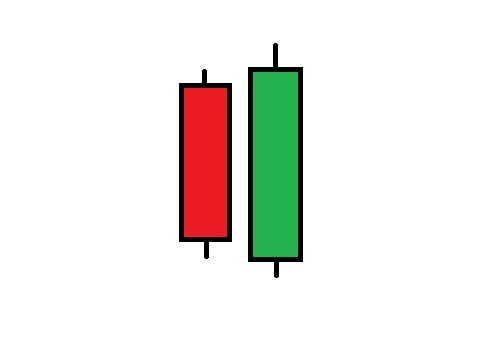
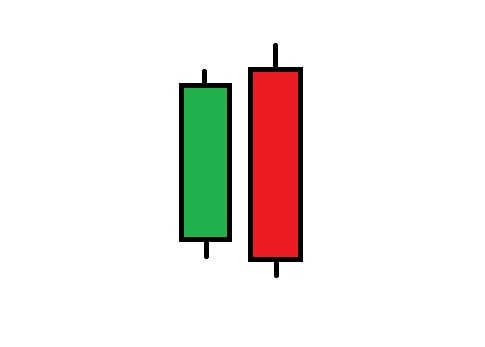
- The bullish engulfing is a two-candle pattern. The body of the second bullish candle completely covers the body of the first candle, which is bearish. That pattern means that pressure from buyers overwhelmed sellers, and the bullish movement had stronger momentum than the bearish one.
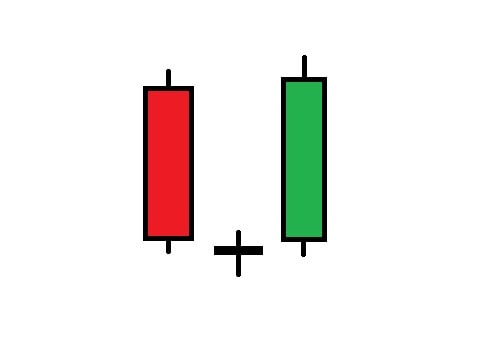
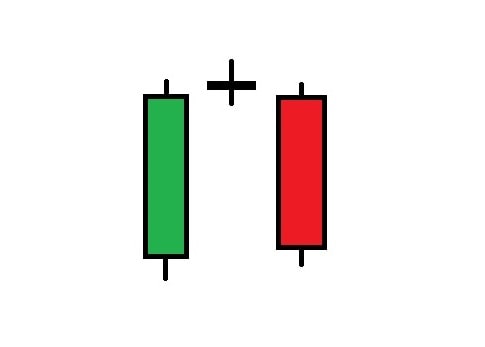
- The morning star is a three-candle pattern. It consists of a candle with a very small body between long bearish and bullish candles. Additionally, the body of the middle candle doesn't overlap with the body of the bearish one. The pattern means that pressure from sellers has been exhausted, and the trend is now bullish.
Bearish Reversal Patterns
- The shooting star is a one-candle pattern that is essentially the opposite of the bullish hammer pattern. A shooting star candle has a small body, little to no lower shadow, and a long upper shadow.
- The evening star. As you may have already guessed, this is the opposite of the morning star pattern. It consists of a candle with a very small body between two long candles, the first one bullish and the second bearish.
- The evening star. As you may have already guessed, this is the opposite of the morning star pattern. It consists of a candle with a very small body between two long candles, the first one bullish and the second bearish.
Support and resistance levels
What is technical analysis in cryptocurrency using support and resistance levels? Support and resistance levels are key price levels where buyers or sellers, respectively, enter the market and make a sufficient volume of trades to stop or reverse a price movement. These levels are indicated by touching a price multiple times without crossing it.
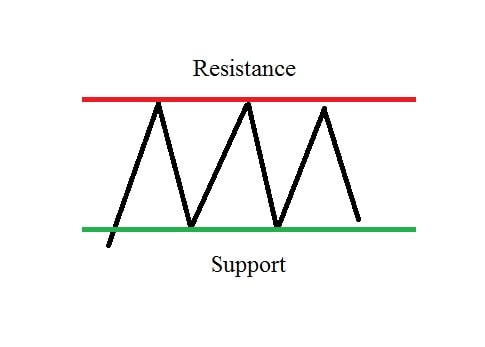
The support level is the level where asset demand is strong enough to stop the price from falling lower. Support is always below the current price. Traders tend to buy at the support level, which drives the price up.
Resistance is the level where an asset's supply is strong enough to stop the price from rising higher. The resistance level is always above the current price. Traders tend to sell at resistance levels, which drives the price down.
Once a price breaks through the resistance level, it becomes the new support. Likewise, if the price breaks through a support level and goes lower, that support level becomes the new resistance.
Technical indicators
Indicators are certain calculations based on various statistics, like price and volume. Basic technical analysis for crypto is usually presented in visual form (lines, histograms, and so on), which are automatically added to the chart. Indicators are designed as additional tools to help traders spot buy or sell signals. There are plenty of indicators, and they're widely used by short-term traders.
Relative Strength Index
One of the most popular indicators of technical analysis of crypto charts is the Relative Strength Index (RSI). It measures the magnitude of recent price changes to identify overbought or oversold conditions in the price of an asset and moves between 0 and 100. When the RSI is above 70, the asset is considered overbought, and there's a good possibility of price decline. When the RSI is below 30, the asset is considered oversold, and there's a good possibility the price will increase. However, it's better to remember that RSI, like other indicators, is only an auxiliary tool and should not be used as the primary buy or sell signal to make decisions.
The best technical analysis tools for cryptocurrency
Before computers and the internet, technical analysis was done manually on paper. Now, it's almost impossible to imagine doing it without convenient computer tools.
The best crypto charts for technical analysis
Although cryptocurrency exchanges usually provide their users with some set of technical analysis tools, they can't compete with those from specialised platforms in terms of their convenience, versatility and power.
- TradingView is arguably the most popular charting and technical analysis platform. It can be used as a powerful cryptocurrency technical analysis software by novice and professional crypto traders alike. Its versatility and immense list of features make TradingView one of the best tools for technical analysis on crypto trading one can have. There are three paid plans available, but also a free plan with less functionality that is still enough for most traders to get started. There are three paid plans available, but also a free plan with less functionality that is still enough for most traders to get started.
- Coinigy is another popular platform that not only gives you access to technical analysis charts for cryptocurrency and other tools but also lets you trade cryptocurrencies on multiple exchanges. It's a paid service but has a free starter account option.
- CryptoWatch is a cryptocurrency charting and trading platform owned by the Kraken cryptocurrency exchange. It's completely free to use for charting, but the premium plan includes some additional benefits.
While the information here is only the basics of technical analysis, it could prove very useful for cryptocurrency trading. Keep learning, and you'll be able to reap the fruits of your persistence.
Tags
Try our Bitcoin Cloud Miner and get additional crypto rewards based on your trading volume. It's immediately available upon registration.
Try our Bitcoin Cloud Miner and get additional crypto rewards based on your trading volume. It's immediately available upon registration.
FAQ
What is technical analysis in crypto?
Technical analysis in crypto involves analysing crypto charts, digital currency data, and cryptocurrency market trends. It helps assess market volatility, identify market shifts, and recognise breakouts in the crypto market.
How to do a crypto technical analysis?
To conduct advanced crypto technical analysis, select a trading pair and a suitable timeframe, ranging from minutes to months. Utilise candlestick charts to visualise price movements, identify trends, and draw trendlines. Pinpoint support and resistance levels for strategic entry and exit points. For additional insights, apply technical indicators such as Moving Averages, RSI, MACD, and Bollinger Bands. Recognise chart patterns like head and shoulders, triangles, and flags to gauge potential trend reversals or continuations. Factor in trading volume to confirm trends or signal reversals. Implement risk management strategies, including stop-loss orders, and maintain awareness of news and events influencing the market. While technical analysis is a valuable tool, it's advisable to integrate it with fundamental analysis and employ a diversified approach for more informed decision-making.
Does technical analysis work in crypto?
To identify market trends in cryptocurrency, traders rely on technical analysis, which involves studying cryptocurrency charts. This helps investors determine the market's future direction and locate potential opportunities.
Is technical analysis easy to master?
Mastering technical analysis in crypto trading is not a straightforward task. It requires understanding and incorporating various new signals and patterns that have emerged over time. This analytical approach can be applied to any financial instrument with accessible historical trading data, predominantly used to forecast short-term price fluctuations.